| Return to Main Page | Next: Objects in Spacetime |
1. Spacetime Fundamentals
Features Introduced
- The
geom.LorentzTransformabletype, and one example, thegeom.STVector - The
LorentzTransformable.draw_optionsattribute - The
spacetime.physical.stgridfunction - Spacetime diagrams using
visualize.stplot- Plotter objects
The specrel package is a tool for drawing and animating objects in spacetime. More specifically, “(1+1)-D” spacetime, which means one dimension of time and one dimension of space.
Before we make any plots, let’s make the necessary imports.
# Core geometry objects
import specrel.geom as geom
# Common spacetime objects
import specrel.spacetime.physical as phy
# Visualization tools
import specrel.visualize as vis
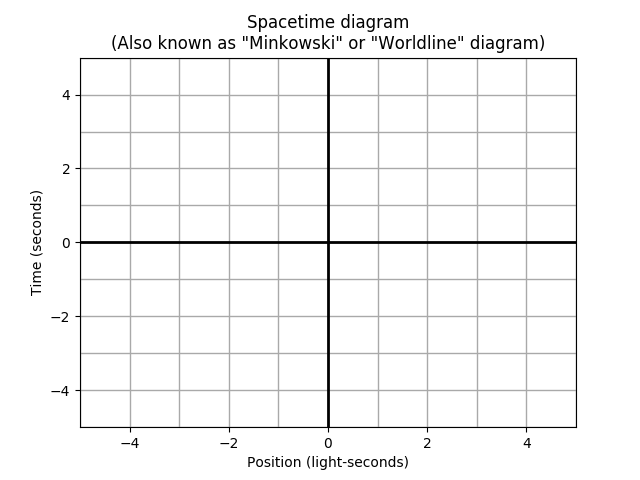
The simplest type of graphic is called a spacetime diagram (also known as a “Minkwoski diagram” or “worldline diagram”), which plots time on the vertical axis and position on the horizontal axis. Each horizontal slice of a spacetime plot represents where objects are at that instant in time.
To start simple, let’s plot a simple grid. First, we need to create a spacetime grid object ranging from -5 to 5 on both axes. Time is plotted in seconds, while position is plotted in light-seconds.
tlim = (-5, 5)
xlim = (-5, 5)
stgrid = phy.stgrid(tlim, xlim)
The variable stgrid now holds an object of the type LorentzTransformable. These are objects that can be plotted and animated in spacetime, as well as manipulated according to the rules special relativity. For now let’s just plot it on a normal spacetime diagram.
plotter = vis.stplot(stgrid,
    title='Spacetime diagram\n(Also known as "Minkowski" or "Worldline" diagram)',
    lim_padding=0)
The stplot function will plot a simple spacetime diagram. Here we’ve specified a title, and for there to be no extra space to be padded onto our specified axis ranges. It returns a plotter object. Plotter objects can do two things: save a plot to an image file, or interactively show a plot as you run a script. Let’s do both.
plotter.save('1-spacetime_grid.png')
plotter.show()
That’s our first plot! It’s just empty space though; let’s actually plot a thing in spacetime.
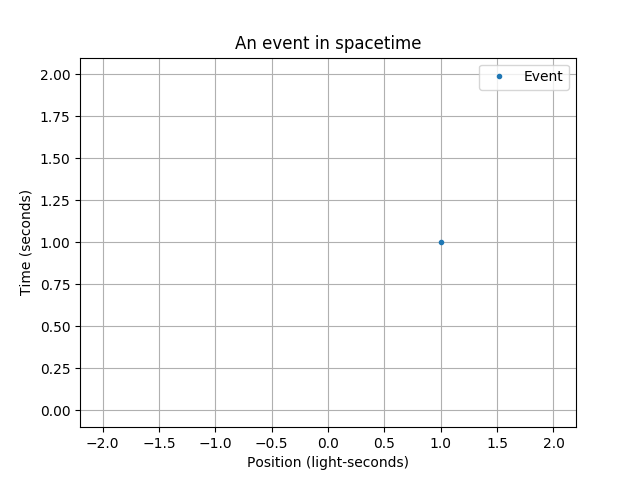
An event is a thing that happens at a specific time and place. Geometrically, it’s just a point in a spacetime diagram, typically denoted as (t, x). Let’s make the point (1, 1), which perhaps represents a flash that happens at a distance of one light-second to our right, one second after a designated starting time.
event = geom.STVector(1, 1, draw_options={'label': 'Event'})
The event variable now holds an STVector, a LorentzTransformable that represents a point in spacetime. We’ve given it the label “Event”, which will appear on our plots if we enable a legend. More generally, all LorentzTransformable objects have a draw_options property, which is a dictionary that can contain standard matplotlib plotting specifications associated with the object, such as the color or the marker type.
Now, let’s plot it with a background grid and a legend.
# Use new axis limits
tlim = (0, 2)
xlim = (-2, 2)
plotter = vis.stplot(event, title='An event in spacetime',
    tlim=tlim, xlim=xlim, grid=include_grid, legend=include_legend)
plotter.save('1-spacetime_event.png')
plotter.show()
To summarize, the general flow of things creating a plot is:
- Create some kind of
LorentzTransformableobject - Set up a plotter (and later, an animator) with the object of interest.
- Save and/or show the plot.
Next, we’ll look at the different types of plottable objects, and some different types of plots and animations that we can make.
| Return to Main Page | Next: Objects in Spacetime |