| Previous: Lorentz Transformations | Next: Time Dilation and Length Contraction |
4. Simultaneity
Features Introduced
- The
geom.PointGrouptype - Comparing frames with
visualizefunctions:compare_framescompare_frames_animatedcompare_frames_animated_with_worldline
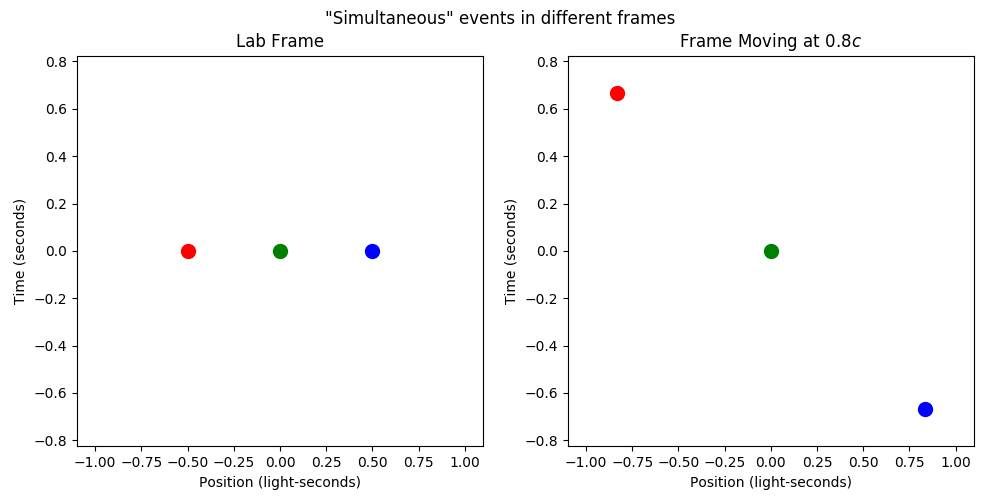
One of the first every physics student learns in special relativity is that the simultaneity of events is relative. That is, events that are simultaneous in one reference frame aren’t always simultaneous in other frames. To see this, let’s set up a scene with “simultaneous” point events.
xvals = [-0.5, 0, 0.5]
colors = ['red', 'green', 'blue']
points = geom.PointGroup(
    [geom.STVector(0, x, draw_options={'color': c})
        for x, c in zip(xvals, colors)]
)
A PointGroup is a special type of Collection that contains only STVectors (i.e. points in spacetime). You can specify different modes such that the points represent distinct points, points to be connected by line segments, or the vertices of a filled polygon. The default mode assumes distinct points, which is what we used here.
We want compare how these “simultaneous” events look in different frames. To do that, visualize has a suite of functions starting with compare_frames*. Let’s just look at the spacetime diagrams to start.
v = 4/5 # Relative velocity between frames
tlim = (-0.75, 0.75)
xlim = (-1, 1)
title = '"Simultaneous" events in different frames'
plotters = vis.compare_frames(points, v, tlim=tlim, xlim=xlim, title=title,
    markersize=20)
p = plotters[0]
p.save('4-simultaneity.png')
p.show()
The compare_frames function returns a list of plotters, one for each frame. They all correspond to the same figure window, so we can just pull one of them to call save and show from.
Notice that we specified markersize in the visualize function instead of in the draw_options properties of the points. Doing this applies the matplotlib draw option to all objects being plotted.
We can also animate the scene in the different frames as the events “flash”, either alone or alongside the corresponding spacetime diagrams.
# Compare the animated scene in different frames
ct_per_sec = 0.5
instant_pause_time = 0.2
anim = vis.compare_frames_animated(points, v,
    tlim=tlim, xlim=xlim,
    ct_per_sec=ct_per_sec,
    instant_pause_time=instant_pause_time,
    title=title,
    markersize=markersize)
anim.save('4-simultaneity_anim.mp4')
anim.show()

# Compare the animated scene in different frames alongside spacetime diagrams
anim = vis.compare_frames_animated_with_worldline(points, v,
    tlim=tlim, xlim=xlim,
    ct_per_sec=ct_per_sec,
    instant_pause_time=instant_pause_time,
    title=title,
    markersize=markersize)
anim.save('4-simultaneity_anim_worldline.mp4')
anim.show()
The ct_per_sec parameter controls how many seconds in the scene pass in one real second of animation. The instant_pause_time parameter controls the “pause time” in seconds when the animation hits an “instantaneous” event like a spacetime point.
Note that equal time values among the animations of each frame don’t have any physical meaning. For example, the “t = 0.2” in the “lab frame” doesn’t actually correspond to the “t = 0.2” in the “other frame”, besides the fact that the two animations are “zipped” together. As we’ll see next module, the rate of time differs between the two frames, so time values are totally incommensurate between frames (except for t = 0, which is fixed to be the same in both frames).
Comparing the plots, it’s apparent that the events we set to be simultaneous in our original (“lab”) frame are not simultaneous in a frame moving at 80% the speed of light to the right (note the different vertical positions of the points).
The relativity of simultaneity is what gives rise to the probably more famous results of special relativity: time dilation and length contraction. We’ll see these in the next module.
| Previous: Lorentz Transformations | Next: Time Dilation and Length Contraction |